
BIBLIOMETRICS
Intro to Bibliometrics
Bibliometrics is an interdisciplinary research and application field concerned with the measurability and quantitative analysis of scientific publication and citation data. How does it work? It is based on data that describes scientific articles, such as authors’ names, article title, source title, publication year, and authors’ affiliations (= organizational addresses). This data is generated as metadata in the publication system and is primarily processed for information retrieval purposes in databases such as Web of Science, Scopus, and, more recently, OpenAlex. On this world map, you can see that new scientific papers are constantly being published around the globe—the map displays the latest 100 publications recorded in the databases Crossref and OpenAlex within the past 48 hours. Each point marks the location of the first author on the world map. Click on the points to learn more about the publications. Do different or often the same geographical clusters emerge over time? You’d have to look quite often to find out…!
Time is thus an important factor in bibliometrics, while authorship and the affiliations related to authors are another: To derive more robust evidence from isolated patterns regarding, for example, the productivity of an organization or a country’s research system, the publication data is aggregated over time. Additionally, affiliation data allows us to determine authors’ assignments to their institutions—such as universities—and, through them, with countries, enabling publications to be aggregated at these levels. The second, interactive map above provides an overview of the 200 most productive institutions in Germany. Each circle represents the number of publications in 2026; circles with a light border denote a single institution, while circles without a light border are further subdivided with a click of the mouse. By clicking on an institution circle, you can view the name of the respective institution and visit its website. The assignment of affiliation data to institutions—here based on OpenAlex—is curated quarterly by the KB. The design, data, and configurations for both maps are described in this <a href=“https://open-bibliometrics.de/posts/20260804-DigitalWindow/”>Blogbeitrag</a>.
Other bibliometrically usable data includes subject categories for disciplinary classification, information on research funding, and citation counts, which are also continuously generated within the publication system by the aforementioned databases that analyze the reference lists of newly published works and link them to the cited publications.
A central premise of bibliometrics is that information on scientific publications—as key outputs of research—and their citations can, beyond their individual content, yield insights into the structures and dynamics of the publication and science system when analyzed in aggregated form. One of the historical roots of bibliometrics lies in the search for empirical laws, such as Bradford’s Law, originally developed in a library science context. In a related field, patents are often used to analyze knowledge transfer processes towards commercial application.
A core area of classical, evaluative bibliometrics is the development, assessment, and use of indicators to measure characteristics of publication corpora. These indicators are used for the evaluation of institutions, sectors, countries, or individual researchers and research groups. Due to differences in disciplinary cultures, indicators should be field-normalised or otherwise not used for interdisciplinary comparisons. Field-normalised citation rates (FNCR), the field-normalised proportion of highly cited publications or collaboration indicators are used, for example. In contrast, the Journal Impact Factor (JIF) or the H‑index are often critically discussed in the field.
Due to the specific nature of the data, which, as explained above, was not primarily created for this purpose, techniques for data cleansing, disambiguation of entities (especially authors, organisations and research funders) and matching different data sources, as well as methods such as clustering based on co-citations or bibliographic coupling for science mapping, for example.
These techniques, methods, and indicators are also applied in exploratory research settings and contribute to quantitative science and innovation studies—for example, in analyzing the impact of funding programs, gender disparities, the identification of innovations and emerging research fields, or studies on scientific misconduct.
While such questions are typically addressed using statistical analysis, bibliometrics has increasingly developed methodological interfaces with other fields, such as network analysis and information retrieval. It can also be combined with qualitative approaches. Moreover, growing access to full texts and advances in natural language processing (NLP) and large language models (LLMs) are additionally enabling the increased consideration of the semantic level in the analysis of publication corpora.
Further information can be found in the Bibliometrics Quick Notes by Dr. Stephan Gauch, which were developed in the context of the KB and funded by the Federal Ministry of Research, Technology and Space.
Analysis blog: The Bibliometric Lens
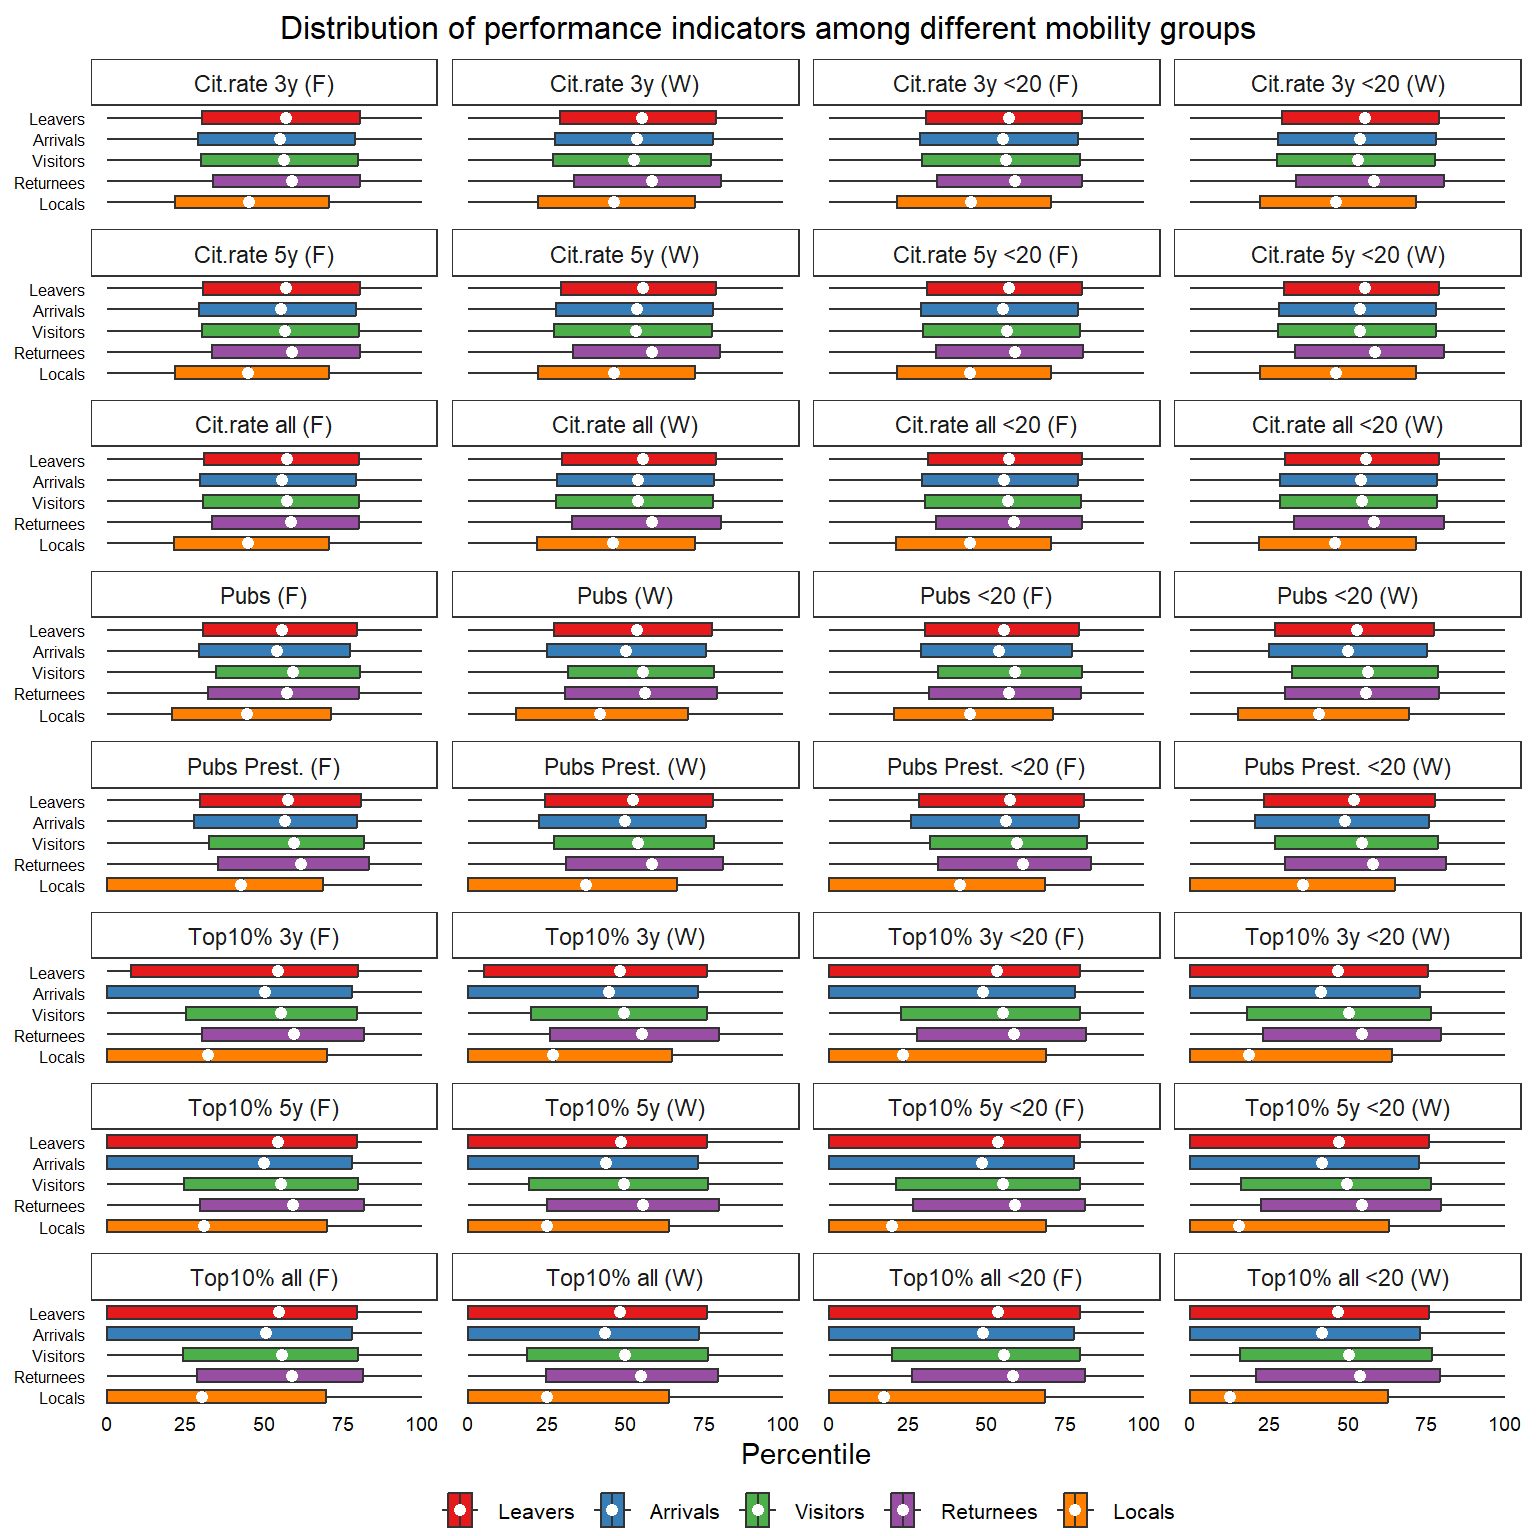
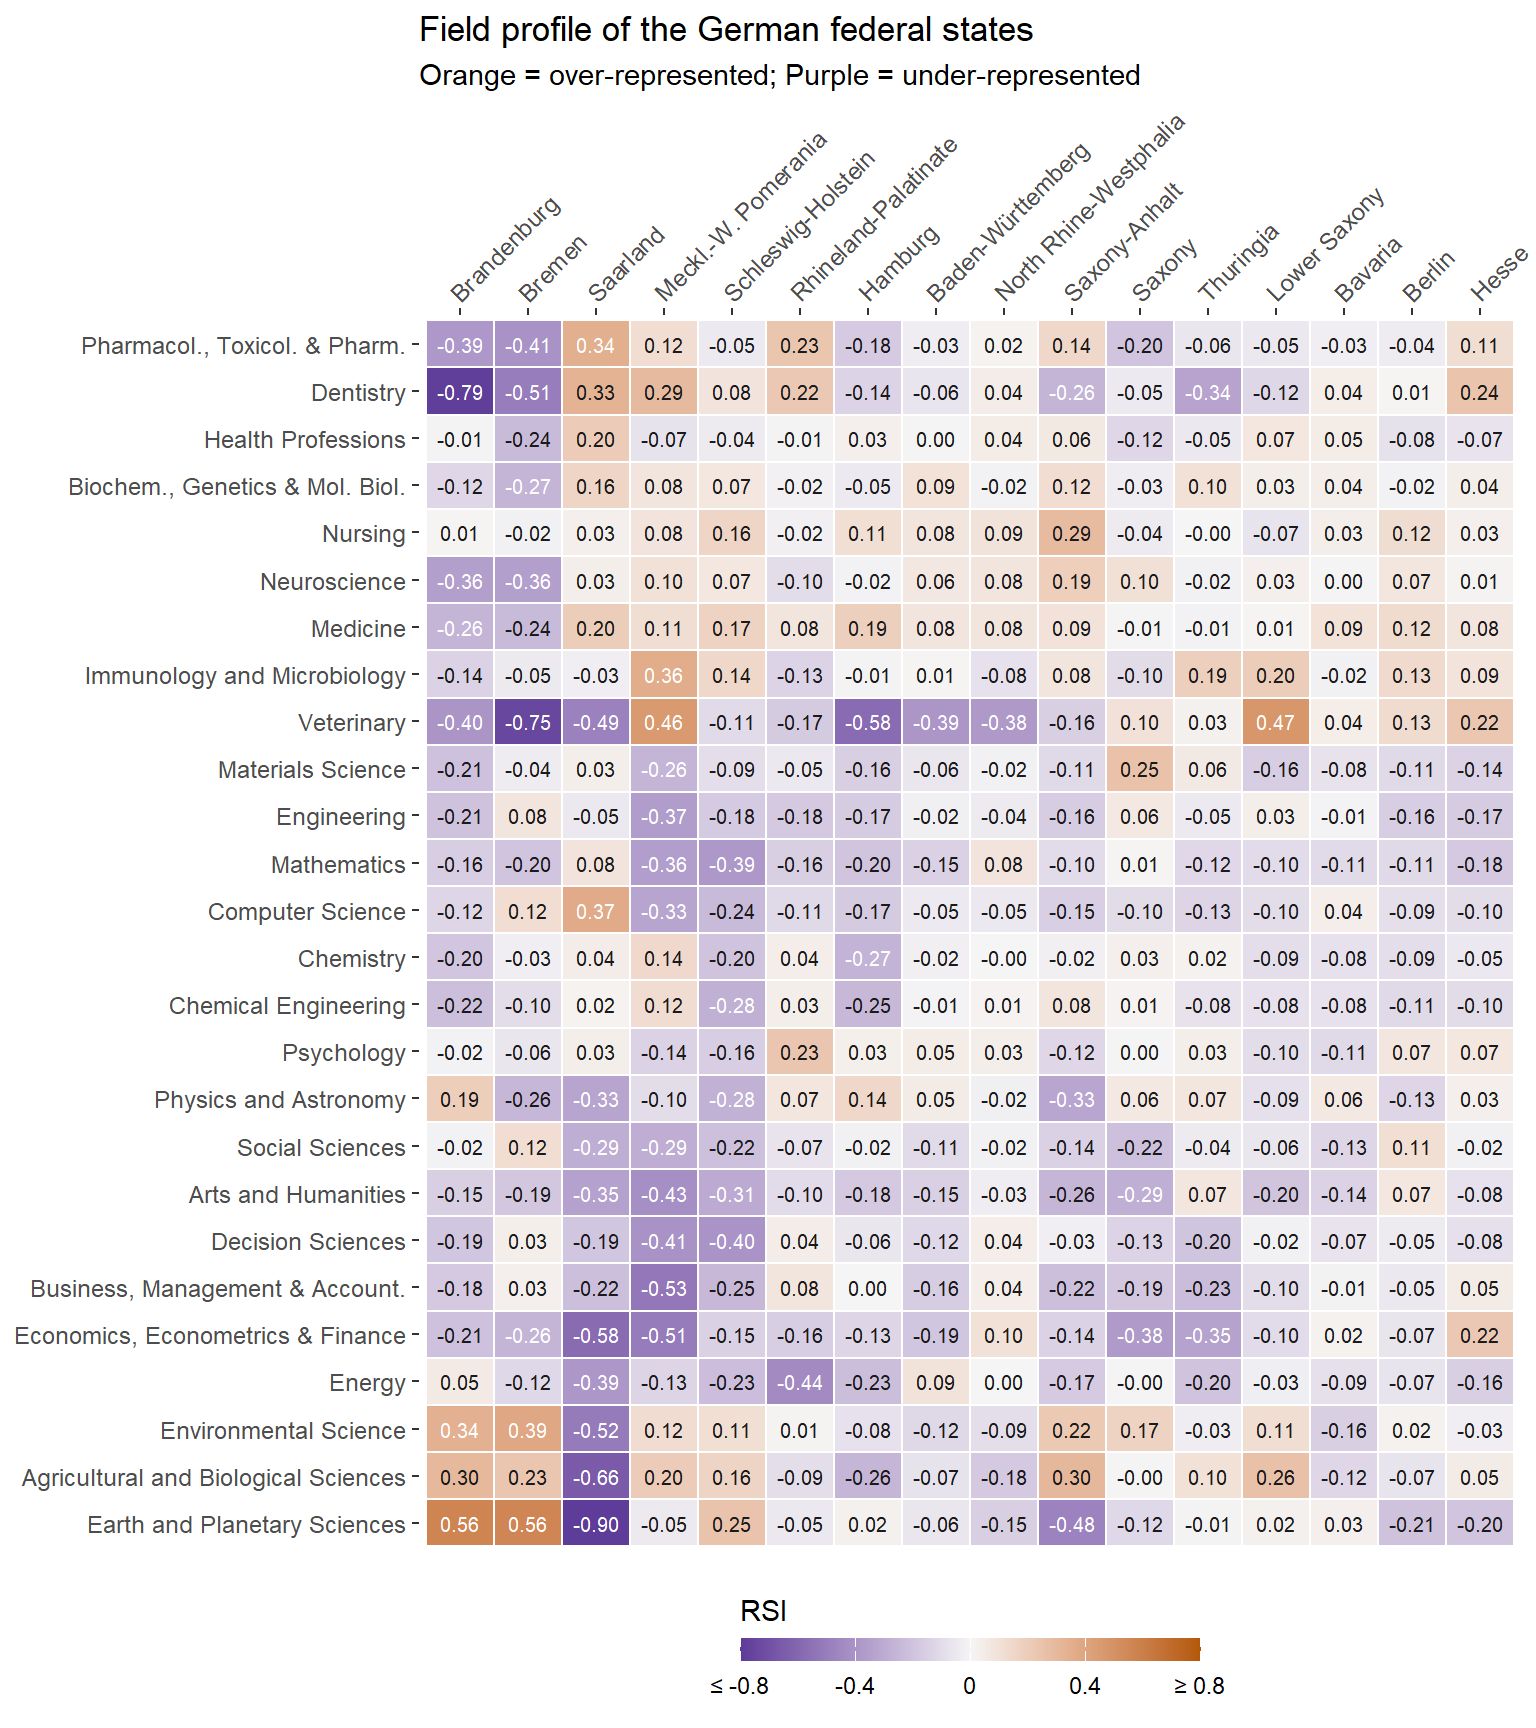
The graphics provide glimpses into recent posts from our blog. On our blog, “The Bibliometric Lens,” we publish short, data-exploratory pieces (data short stories) on current topics that are particularly relevant to science politics and governance. The posts offer quick insights based on bibliometric data, comprising visualizations and textual explanations. They are not meant to offer comprehensive overviews, although this may be the case in subsequent work.